
Regarding Charts
By creating charts that suit your needs, you can master the basic operations of MetaTrader 5 and learn to read market trends.
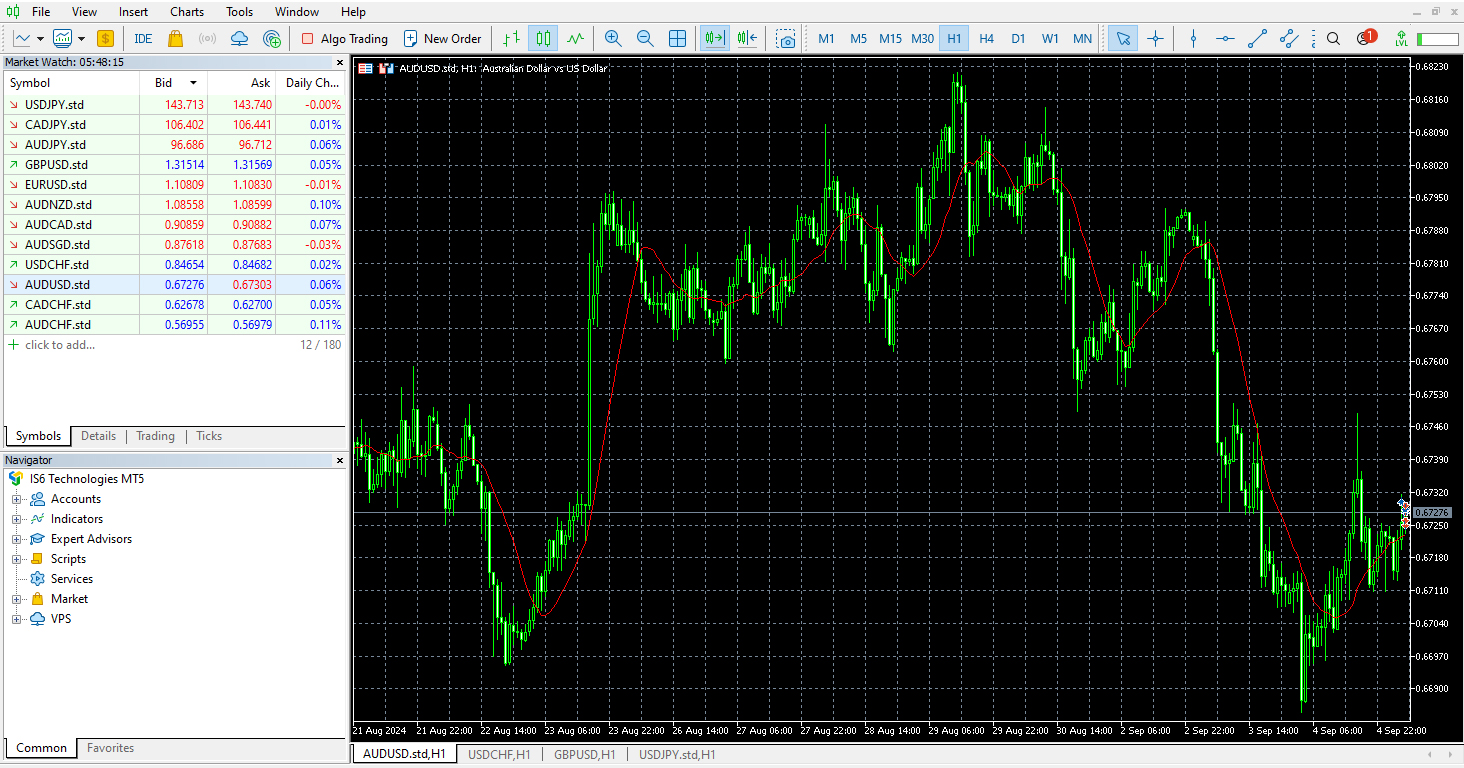
(1) Default Chart
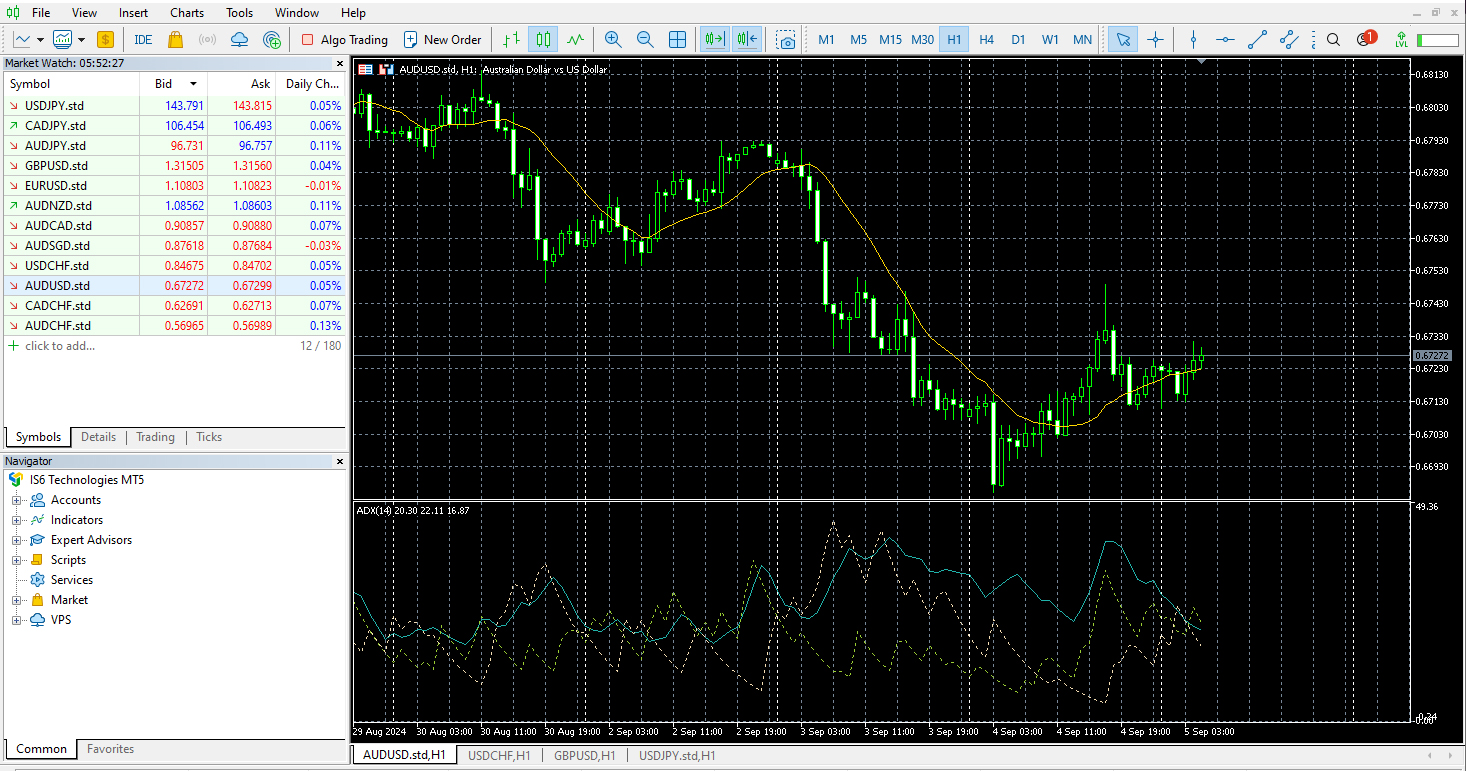
(2) Customized Chart
(3) Comparing Charts and Basic Operations
The images above (1) and (2) show charts of the same currency pair.
By changing the display time, chart type, and adding indicators, the charts can appear entirely different.
MT5 allows for free customization of colors and screen design.
The basic operations for charts are as follows:
– Adding a New Chart
– Window Arrangement (Aligning Charts)
– Changing the Chart’s Symbol
– Changing the Chart Type
– Changing the Time Frame
– Zooming In and Out of the Chart
Adding a New Chart
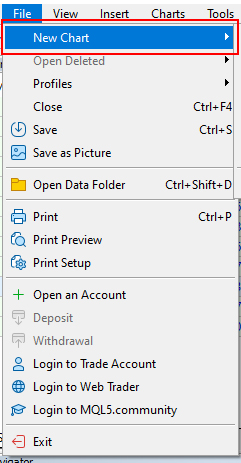
(1) Selecting a New Chart
From the menu, select “File” and then click “New Chart.”
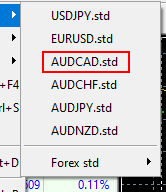
(2) Displaying a Currency Pair
A pop-up with currency pairs will appear. Select the currency pair you want to display.
※In this case, select AUDCAD.
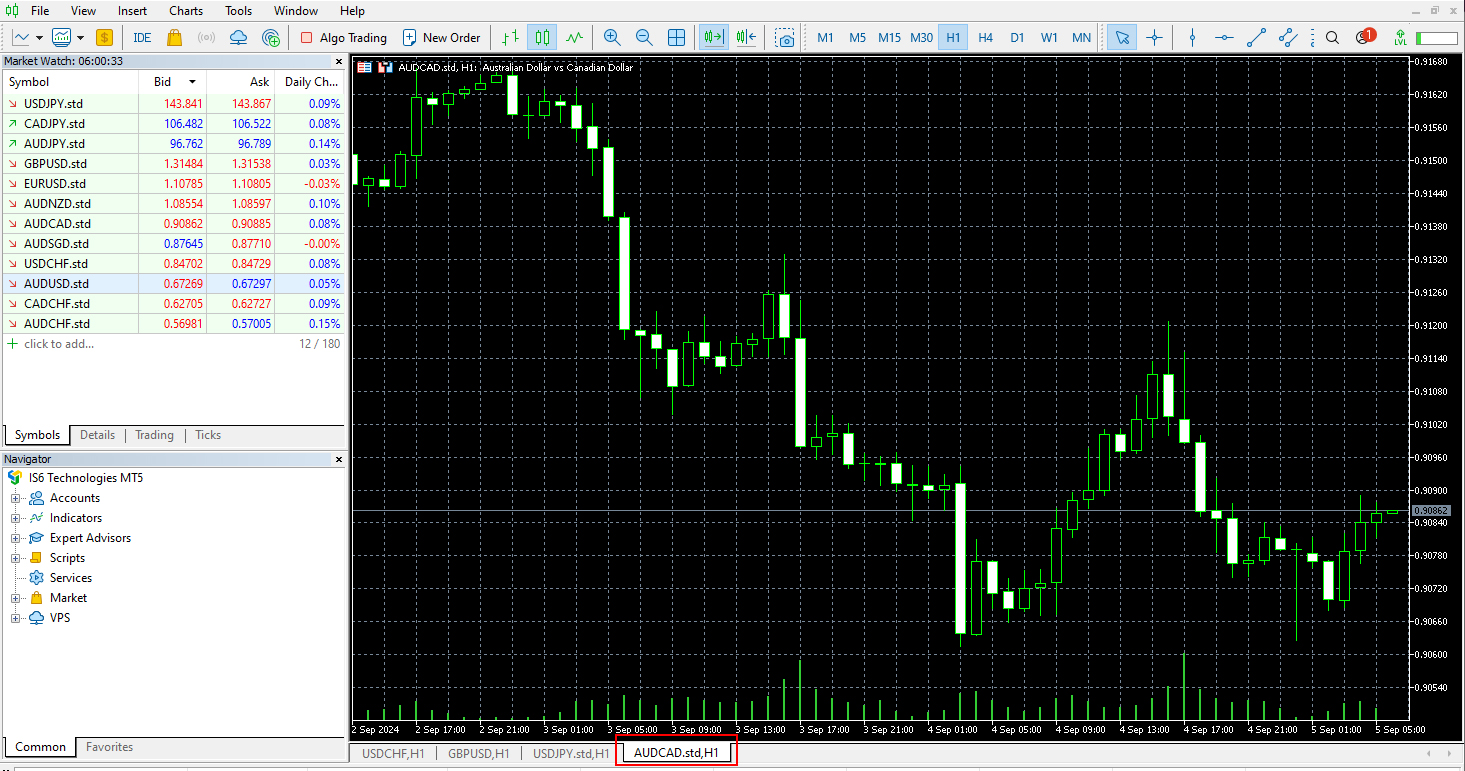
(3) Completing Chart Addition
An hourly chart for AUDCAD has been added.
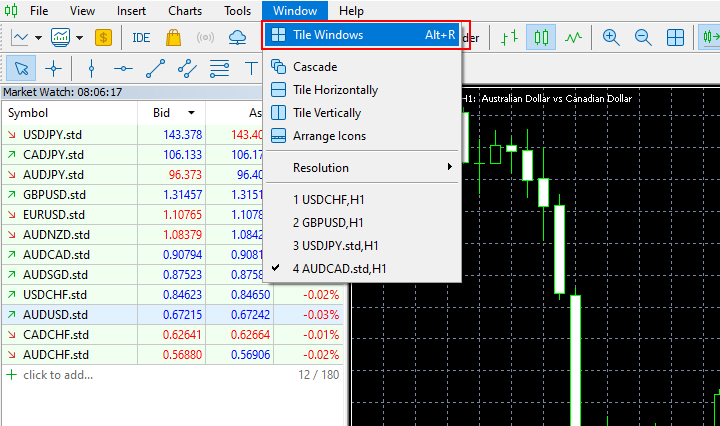
Window Arrangement (Aligning Charts)
(1) Arranging Windows
From the menu, click “Window” and then “Arrange Windows.”
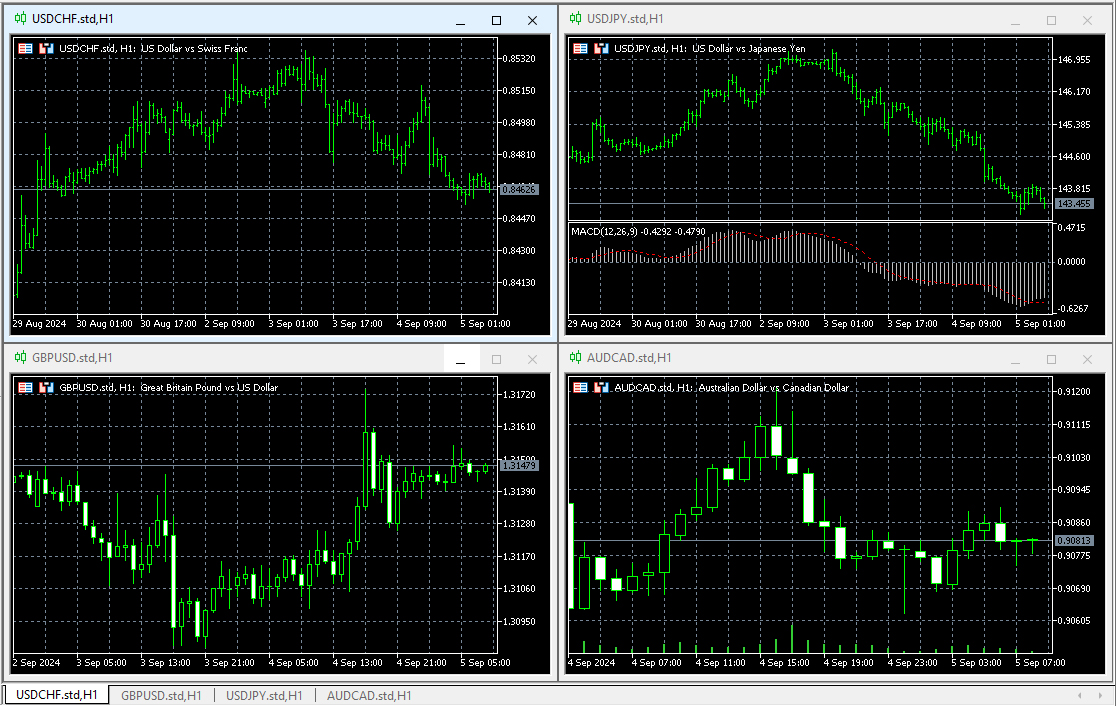
(2) Splitting the Chart Display
Four charts are now displayed in a split view.
(3) Changing the Chart Type
MT5 offers three types of charts: “Bar Chart,” “Candlestick Chart,” and “Line Chart.”
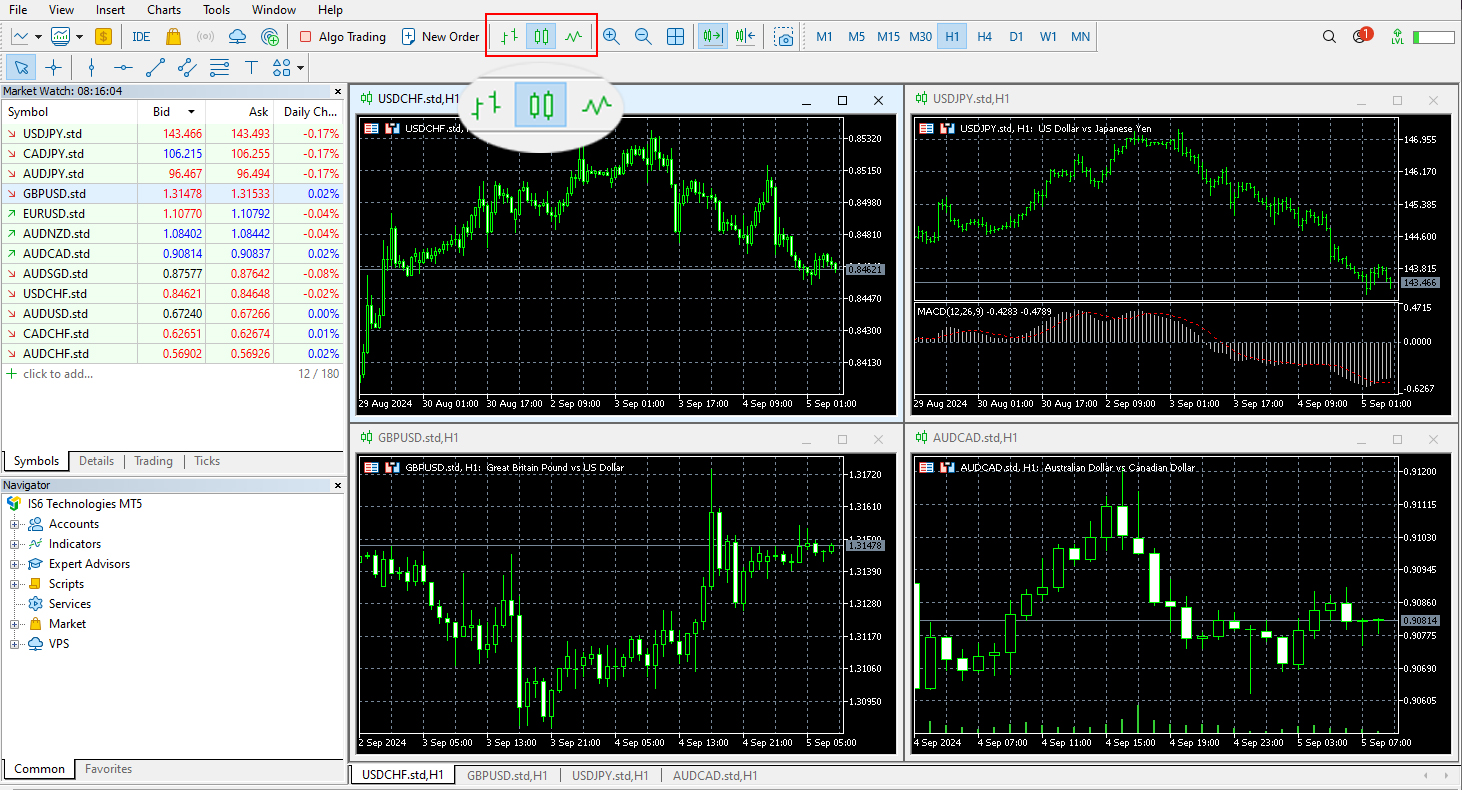
※From left to right: “Bar Chart,” “Candlestick Chart,” “Line Chart.”
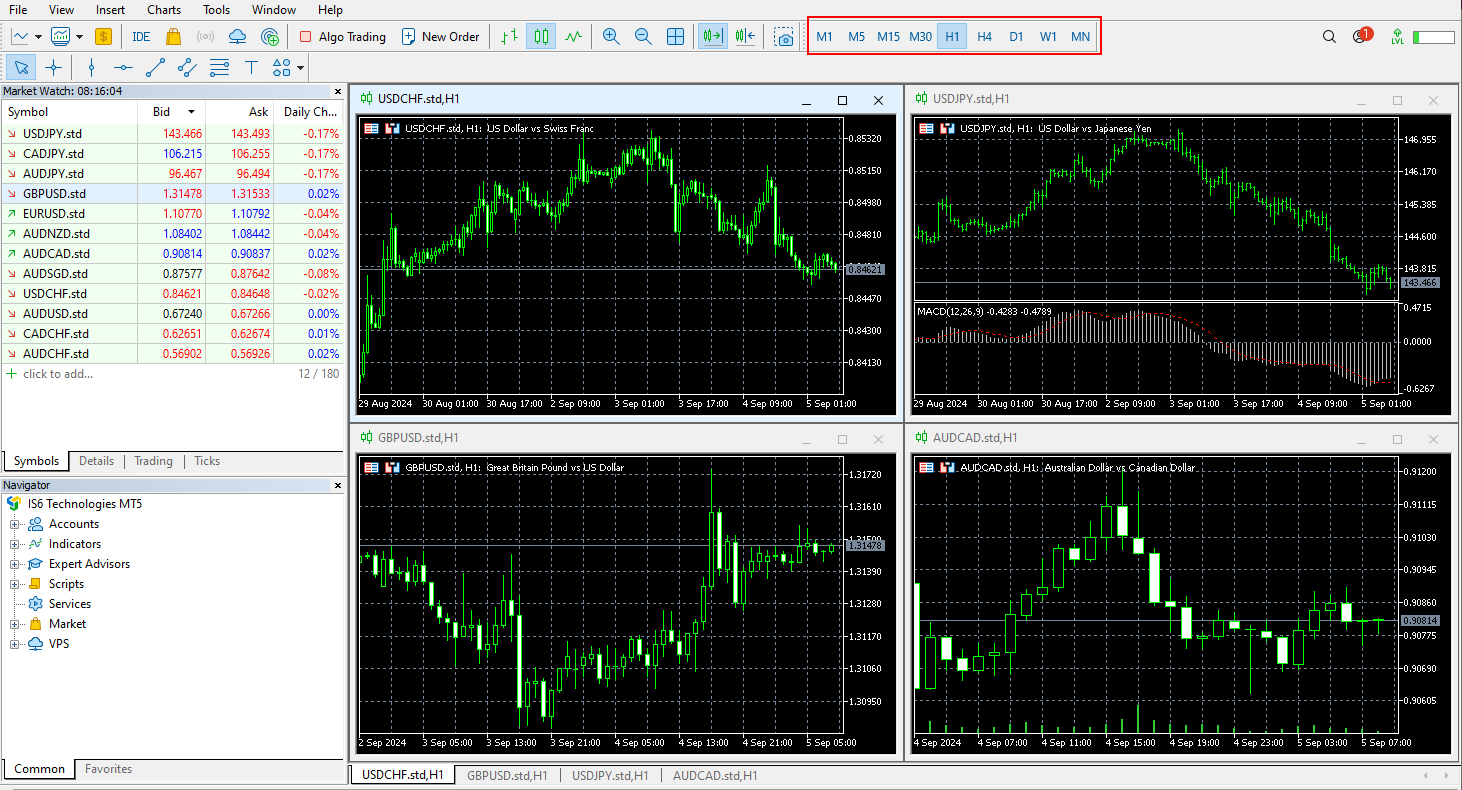
(4) Changing the Time Frame
Press the “H1” button on the toolbar to change to a 1-hour chart.
You can change to nine different time frames:
“1 Minute,” “5 Minutes,” “15 Minutes,” “30 Minutes,” “1 Hour,” “4 Hours (H4),” “Daily (D1),” “Weekly (W1),” and “Monthly (MN).”
(5) Zooming In and Out of the Chart
Use the magnifying glass icon to zoom in and out of the chart.
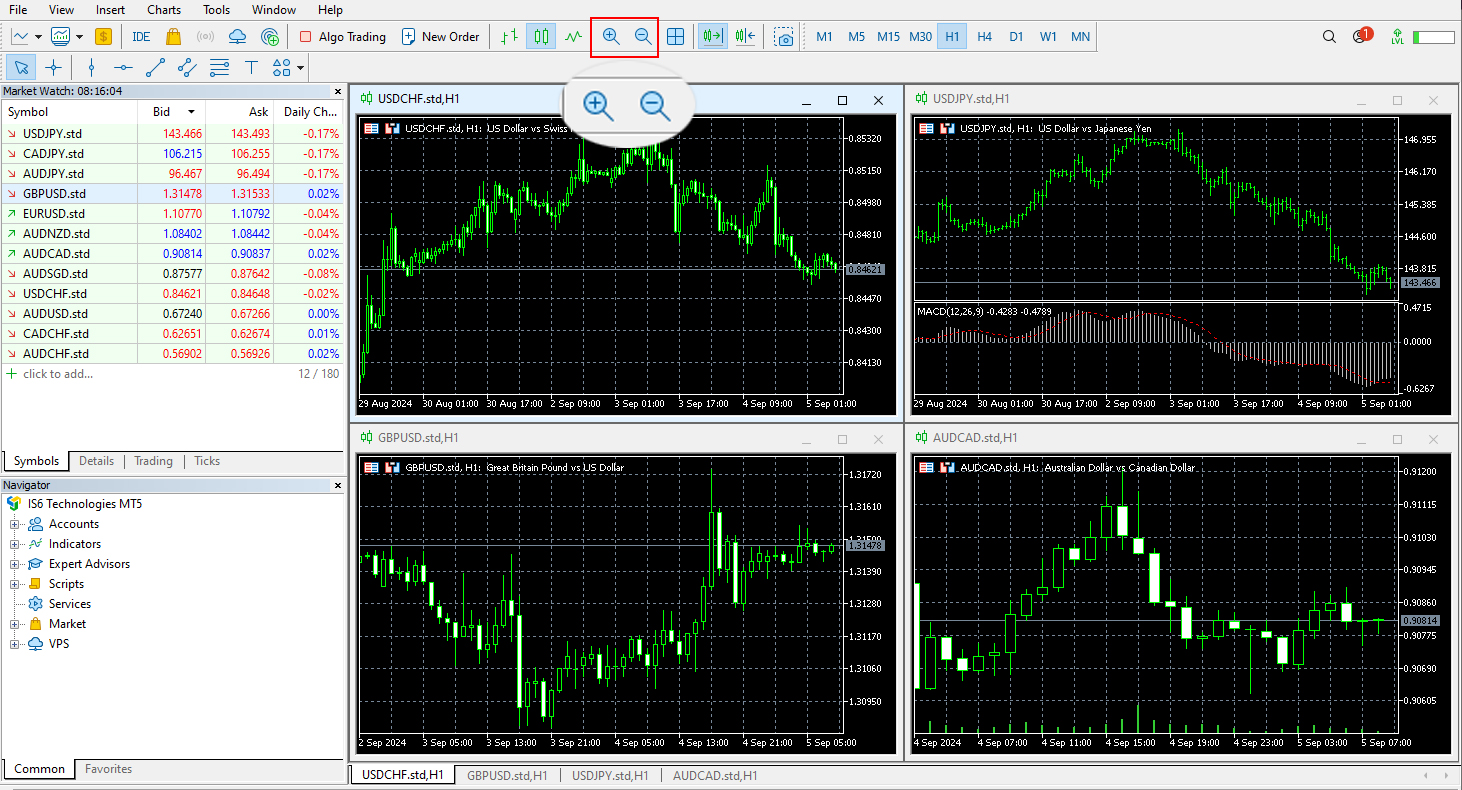
※Note: Even if you have selected the candlestick chart, it may sometimes appear as a bar chart.
In that case, zooming in with the zoom button will display the candlestick chart.
[PC Version MT5] Chapter 10: Let’s Try Using Indicators and Templates