
About Charts
By creating a chart that suits you, you can master the basic operations of MetaTrader 4 (hereafter referred to as “MT4”) and learn to read market trends.
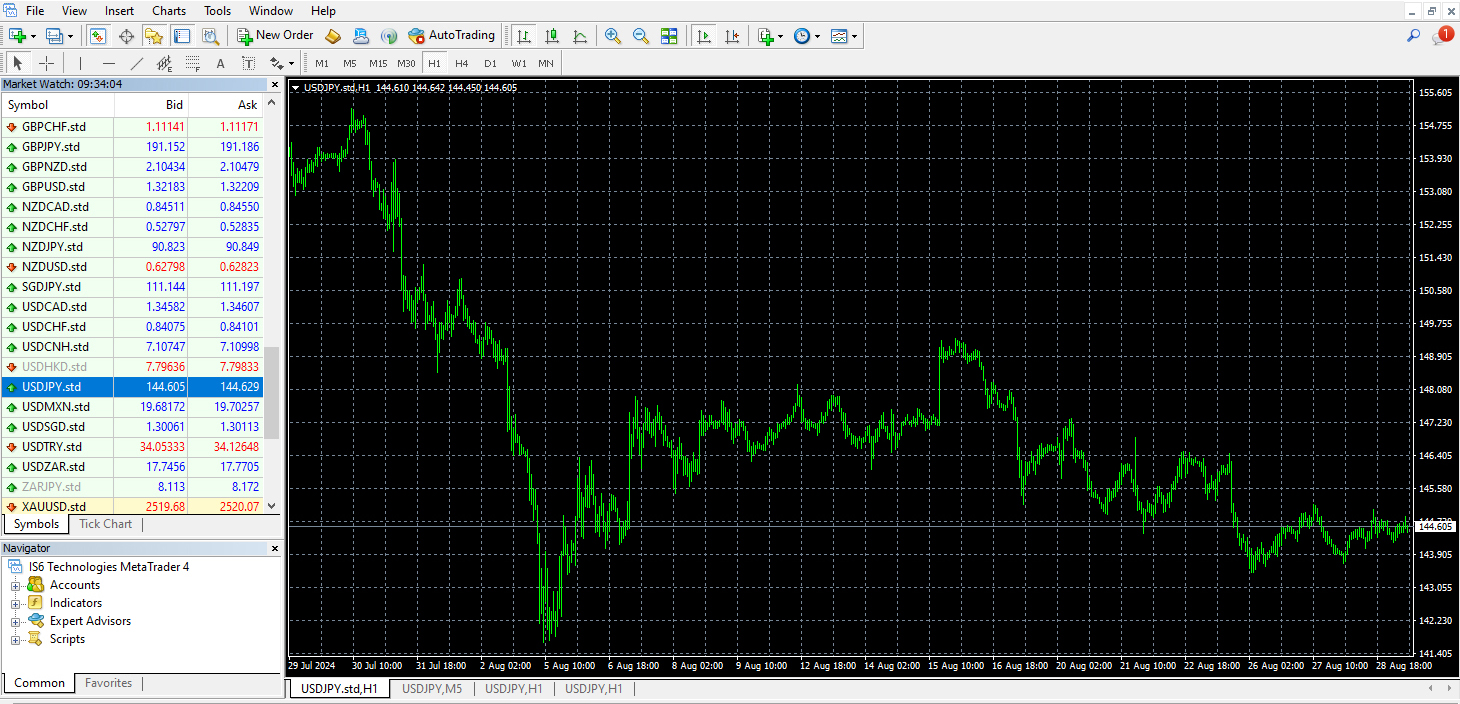
(1) Default Chart
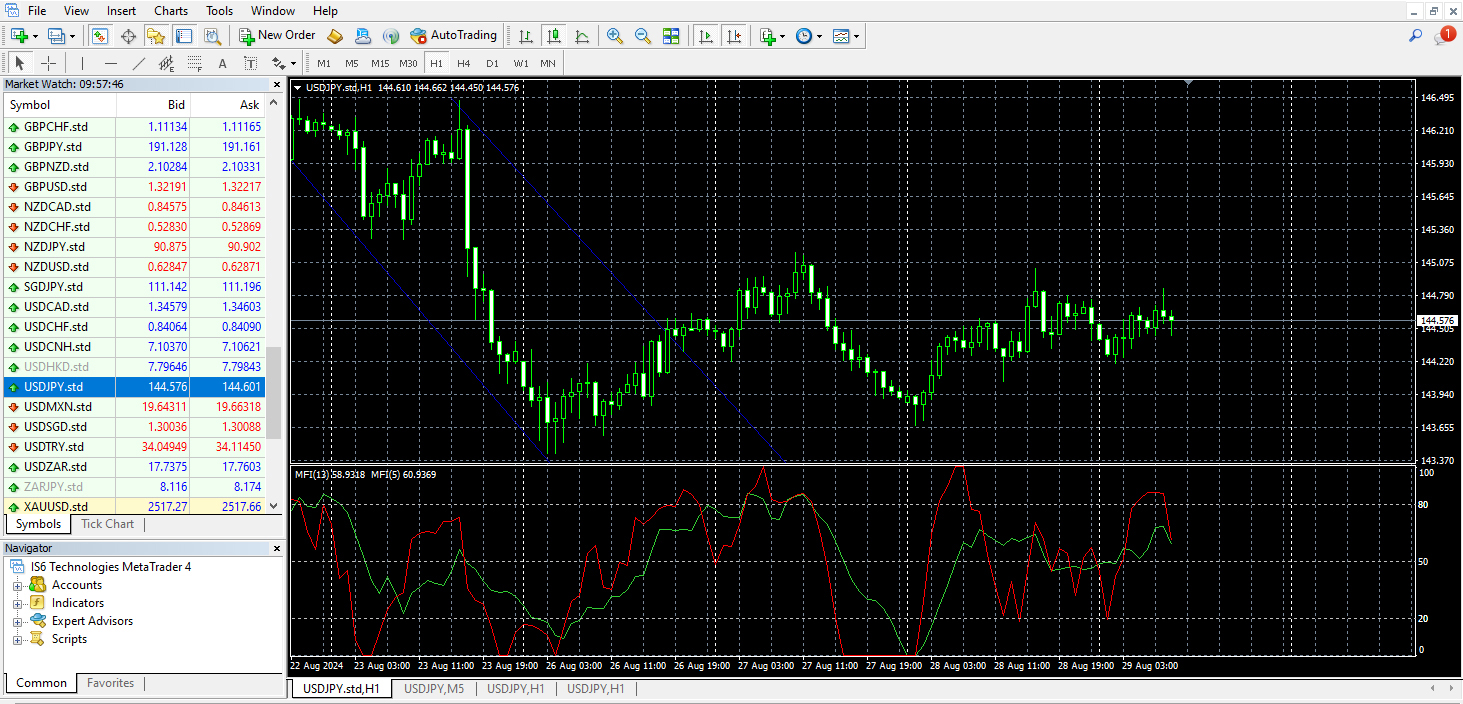
(2) Modified Chart
(3) Chart Comparison and Basic Operations
The above images (1) and (2) are charts of the same currency pair.
However, they appear completely different due to changes in the displayed time, chart type, and added indicators.
In this way, MT4 allows you to freely change colors, screen designs, and more.
The basic operations for charts are as follows:
– Adding a new chart
– Splitting windows (aligning charts)
– Changing the chart’s symbol
– Changing the chart type
– Changing the timeframe
– Zooming in and out of the chart
Adding a New Chart
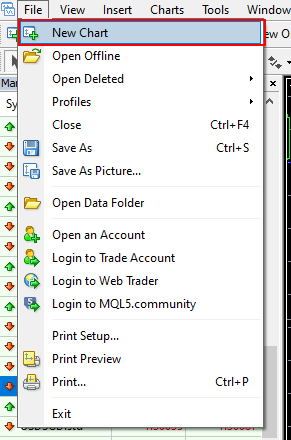
(1) Selecting a New Chart
Select “File” from the menu and click “New Chart.”
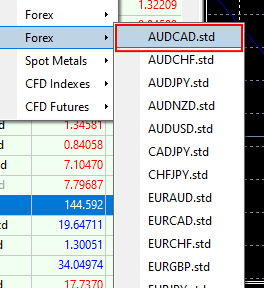
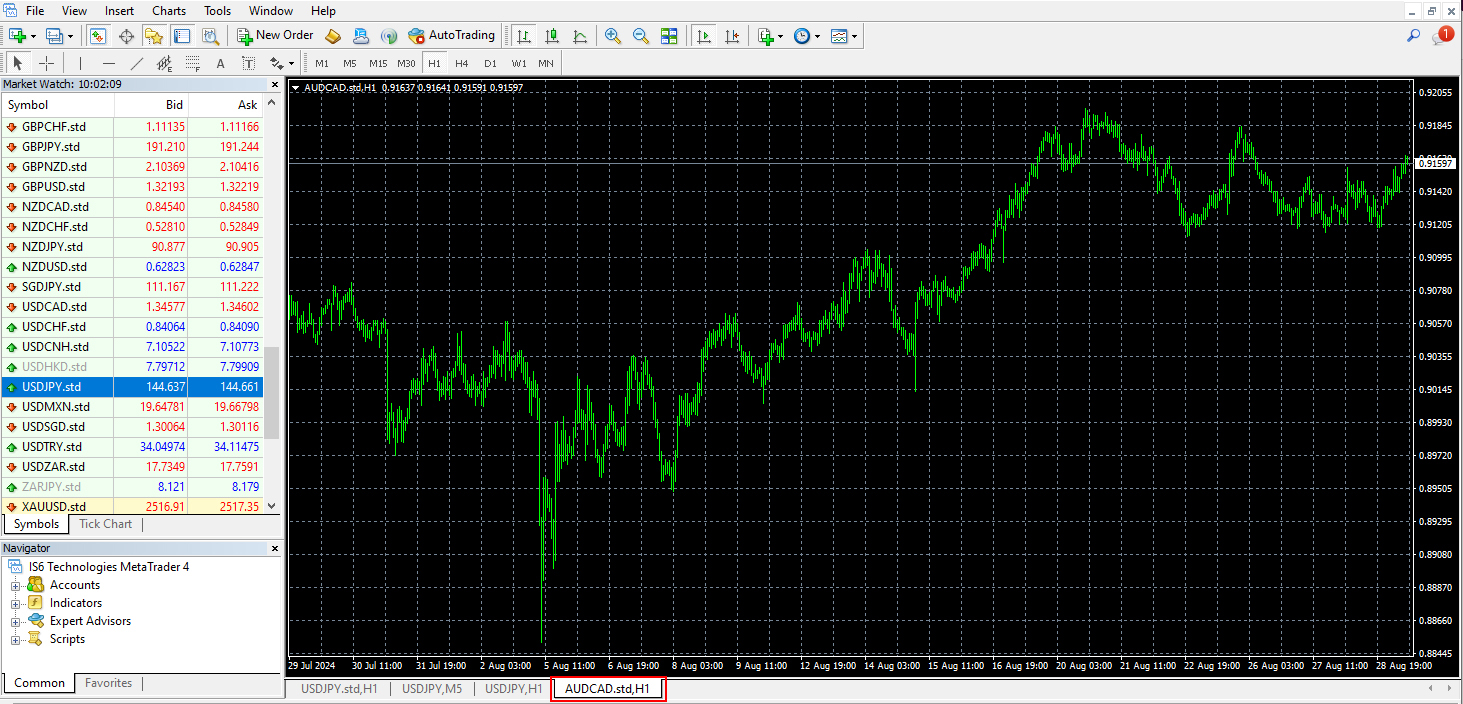
(2) Displaying Currency Pairs
A currency pair popup will open, allowing you to select the currency pair you want to display.
※For this example, select AUDCAD.
(3) Completing the Chart Addition
A 1-hour chart of AUDCAD has been added.
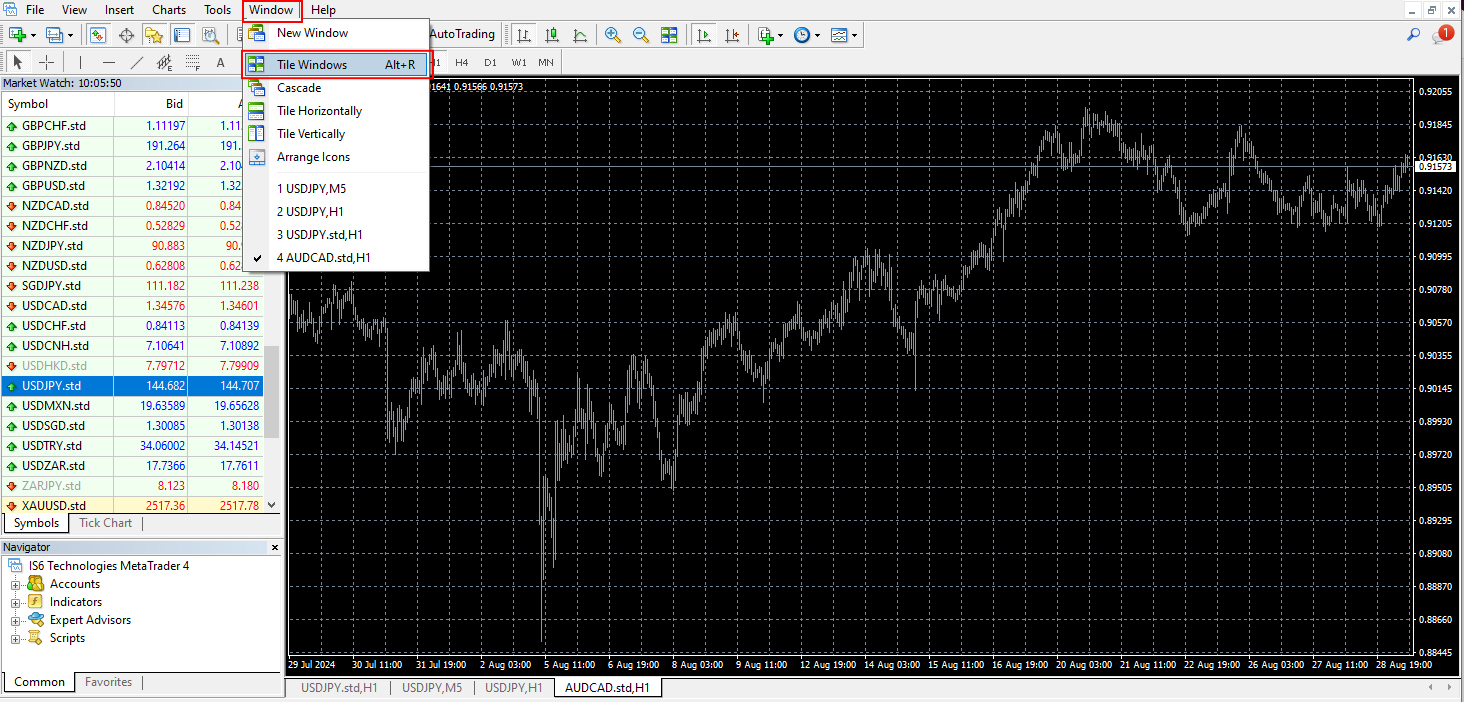
Splitting Windows (Aligning Charts)
(1) Aligning Windows
Click “Arrange Windows” from the “Window” menu.
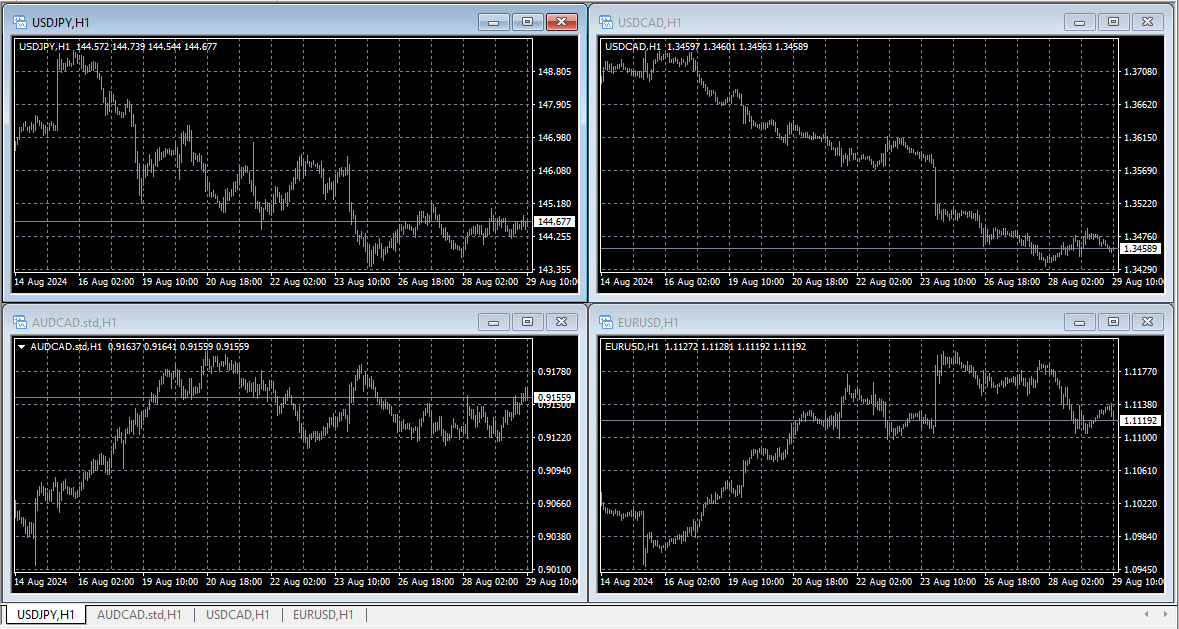
(2) Displaying Split Charts
Four charts are displayed in a split view.
(3) Changing the Chart Type
MT4 offers three types of charts: “Bar Chart,” “Candlestick Chart,” and “Line Chart.”
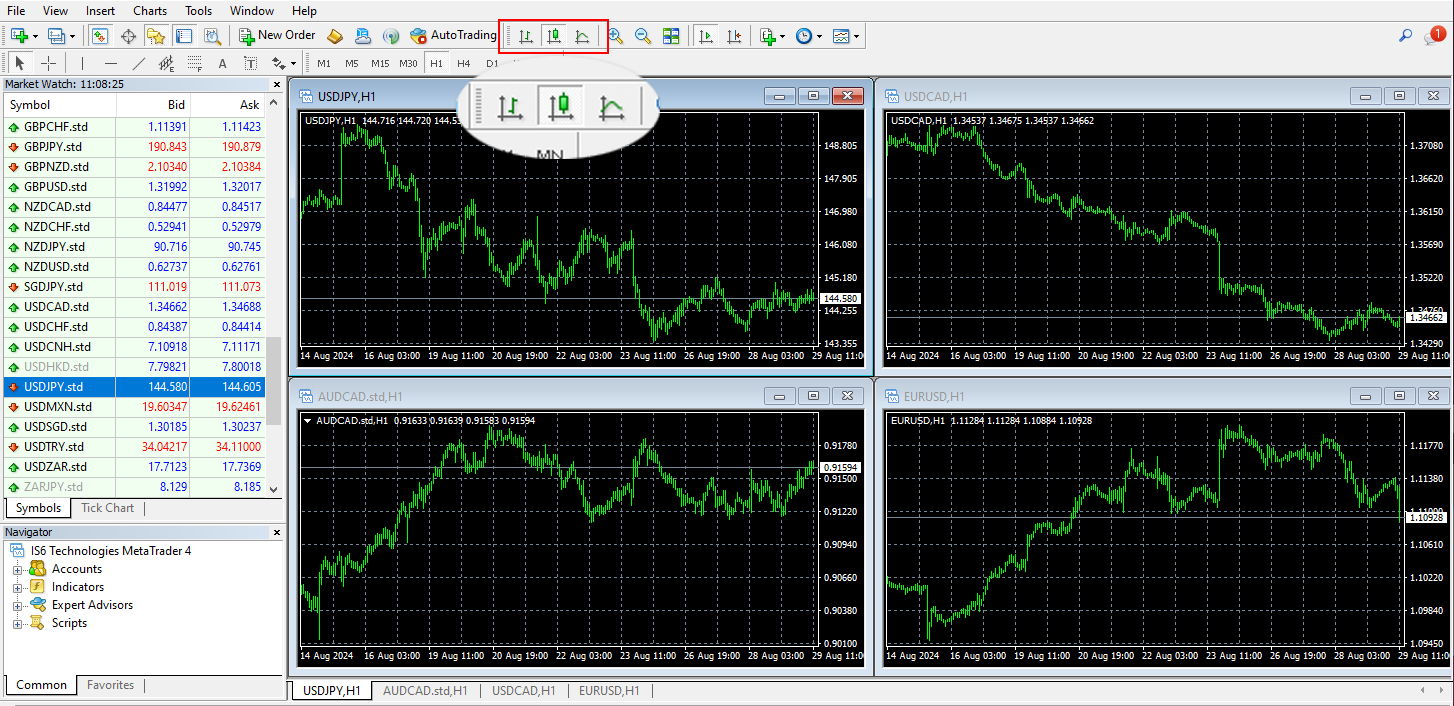
※From left to right, the options are “Bar Chart,” “Candlestick Chart,” and “Line Chart.”
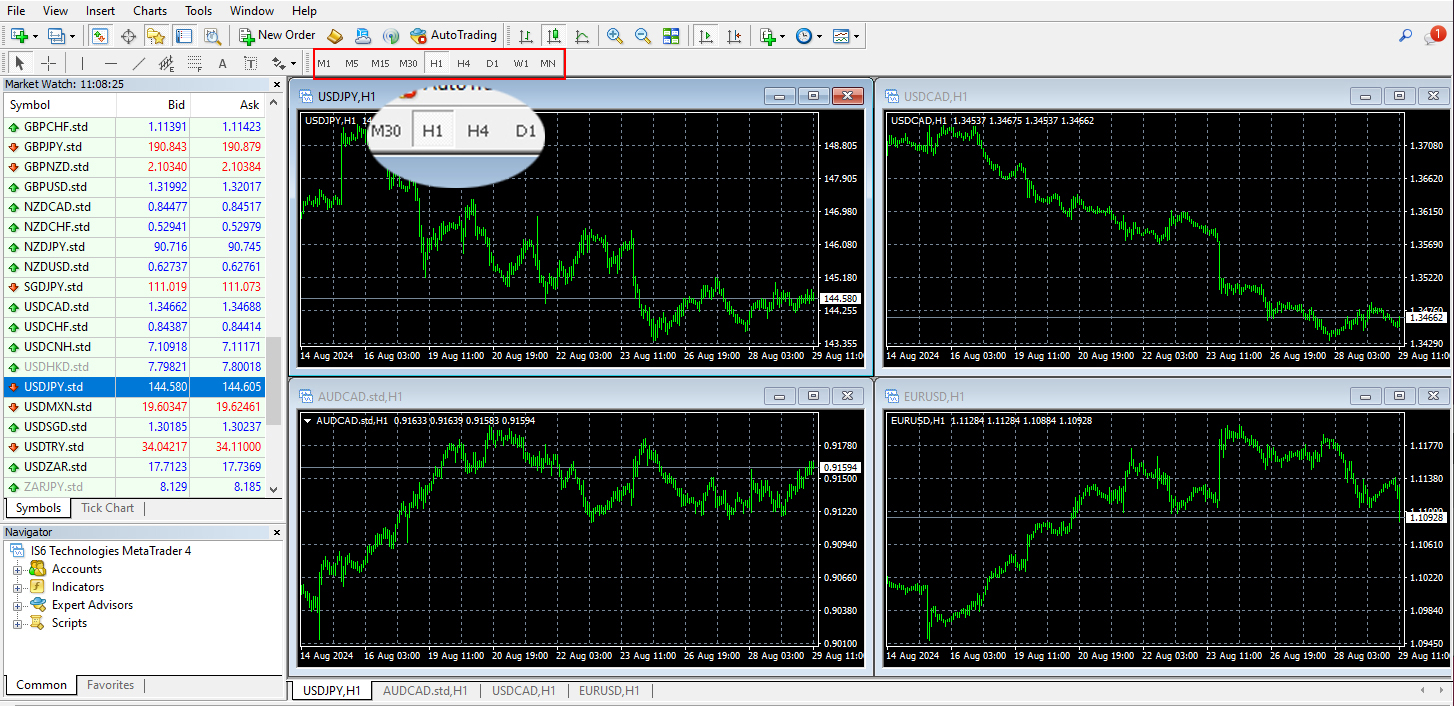
(4) Changing the Timeframe
Press “H1” on the toolbar to switch to a 1-hour chart.
You can change the timeframe to 9 different options:
“1 minute, 5 minutes, 15 minutes, 30 minutes, 1 hour, 4 hours (H4), daily (D1), weekly (W1), and monthly (MN).”
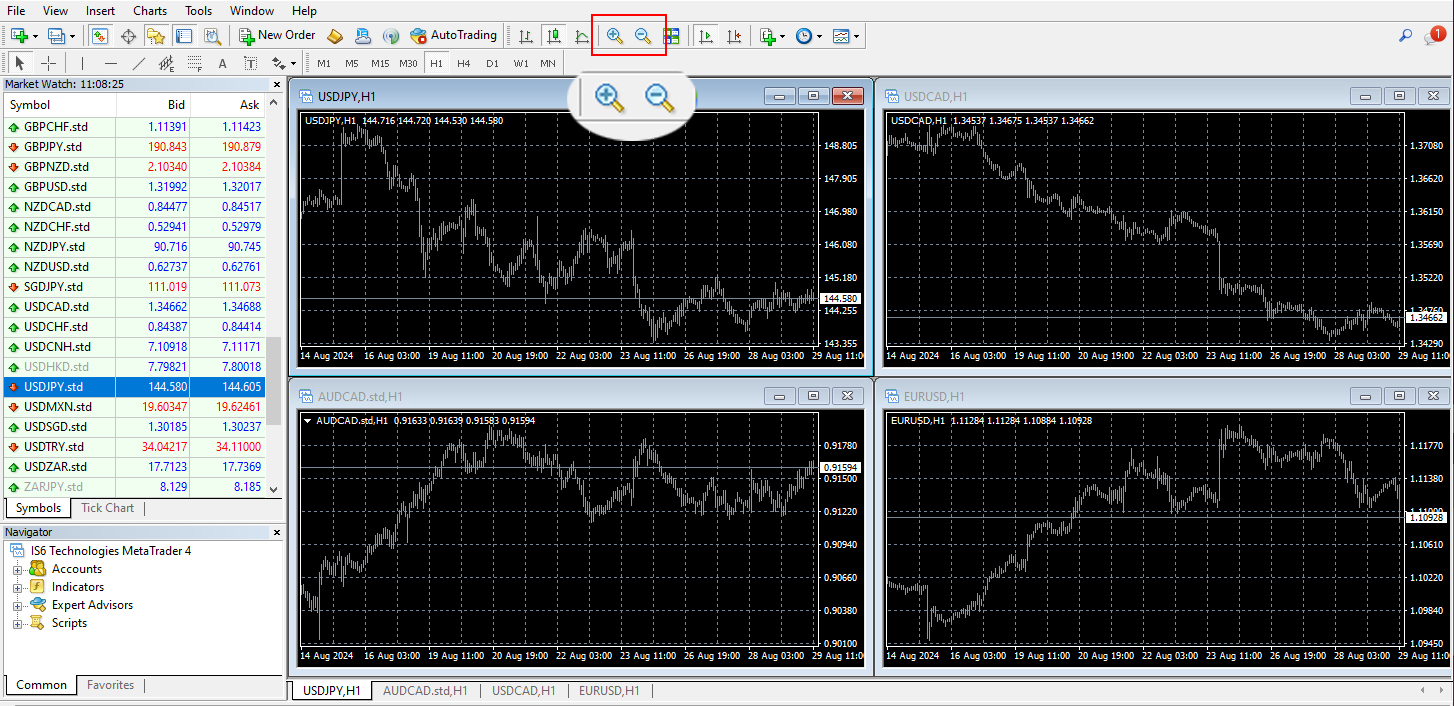
(5) Zooming In and Out of the Chart
You can zoom in and out of the chart using the magnifying glass icon.
※Note: Even if you select the candlestick chart, it may appear as a bar chart.
In such cases, use the zoom button to enlarge it, which will display it as a candlestick chart.
[PC Version] Chapter 10: Let’s Try Using Indicators and Templates